- Action Plan
- Basic steps to get us going just in the server console
- OTLP - wire protocol for OpenTelemetry (supports gRPC and HTTP over Protobu and HTTP over JSON)
- Step up the Game with proper tracing backend (i.e. Jaeger or Zipkin)
- Important concepts of Context and Propagation
Action Plan
This is my sandbox to test and learn OpenTelemetry(OTM) within Ruby ecosystem.
- I start with elementary Rack app and add OpenTelemetry instrumentation to it.
- Then spice it up with Zipkin as a tracing backend(Java☕️)
- May be spice it up with Jeeger as an alternative tracing backend(it is in GO, and fresher)
- Next, I will dive into misc OTM concepts such as Span, SpanContext, etc.
- Manual instrumentation(within ruby/rack)
- Automatic instrumentation with non-ruby tech
- Manual instrumentation(within non ruby/rack)
- Then, may be, I will try to add OTM instrumentation to a Sinatra app.
- Then, I will try to add OTM instrumentation to a Rails app.
Useful bedtime RTFM MELT 101
Basic steps to get us going just in the server console
Add OpenTelemetry instrumentation to the app (Rack+RackUp as an example here) - will output OTM to the console
require 'opentelemetry/sdk'
require 'opentelemetry/exporter/otlp' # this is optional, if you want to use OTLP exporter, can be Zipkin, Jager, etc I believe
# require 'opentelemetry/instrumentation/all'
require 'opentelemetry/instrumentation/rack'

ENV['OTEL_TRACES_EXPORTER'] = 'console'
OpenTelemetry::SDK.configure do |c|
  c.use 'OpenTelemetry::Instrumentation::Rack'
end
(For Rack only) Add OpenTelemetry instrumentation to the app (RackUp)
use OpenTelemetry::Instrumentation::Rack::Middlewares::TracerMiddleware
Rack up the app and curl it
rackup
curl http://localhost:9292
Check the OTM output in your console, should be similar to this:
#<struct OpenTelemetry::SDK::Trace::SpanData
 name="HTTP GET",
 kind=:server,
 status=
  #<OpenTelemetry::Trace::Status:0x0000000104574248
   @code=1,
   @description="">,
 parent_span_id=
  "\x00\x00\x00\x00\x00\x00\x00\x00",
 total_recorded_attributes=6,
 total_recorded_events=0,
 total_recorded_links=0,
 start_timestamp=1680164703245777000,
 end_timestamp=1680164703245816000,
 attributes=
  {"http.method"=>"GET",
   "http.host"=>"127.0.0.1:9292",
   "http.scheme"=>"http",
   "http.target"=>"/",
   "http.user_agent"=>"curl/7.86.0",
   "http.status_code"=>200},
 links=nil,
 events=nil,
 resource=
  #<OpenTelemetry::SDK::Resources::Resource:0x00000001046f1a58
   @attributes=
    {"service.name"=>"unknown_service",
     "process.pid"=>71279,
     "process.command"=>
      "/Users/friendlyantz/.asdf/installs/ruby/3.1.3/bin/rackup",
     "process.runtime.name"=>"ruby",
     "process.runtime.version"=>"3.1.3",
     "process.runtime.description"=>
      "ruby 3.1.3p185 (2022-11-24 revision 1a6b16756e) [arm64-darwin22]",
     "telemetry.sdk.name"=>"opentelemetry",
     "telemetry.sdk.language"=>"ruby",
     "telemetry.sdk.version"=>"1.2.0"}>,
 instrumentation_scope=
  #<struct OpenTelemetry::SDK::InstrumentationScope
   name="OpenTelemetry::Instrumentation::Rack",
   version="0.22.1">,
 span_id="\xD1\xD8\xFF*\x8F\xF1\xEC\xE7",
 trace_id=
  "\xECP\xC5\xDC\xE5)&\xA3,q[,\xF1T\xDE\xB3",
 trace_flags=
  #<OpenTelemetry::Trace::TraceFlags:0x00000001045b4230
   @flags=1>,
 tracestate=
  #<OpenTelemetry::Trace::Tracestate:0x00000001045ac8c8
   @hash={}>>
🎉🎉🎉
OTLP - wire protocol for OpenTelemetry (supports gRPC and HTTP over Protobu and HTTP over JSON)

Step up the Game with proper tracing backend (i.e. Jaeger or Zipkin)
Prerequisites
- Docker (or Colima as a free alternative to run docker command)
- Docker Hub account
Login to Docker Hub
docker login
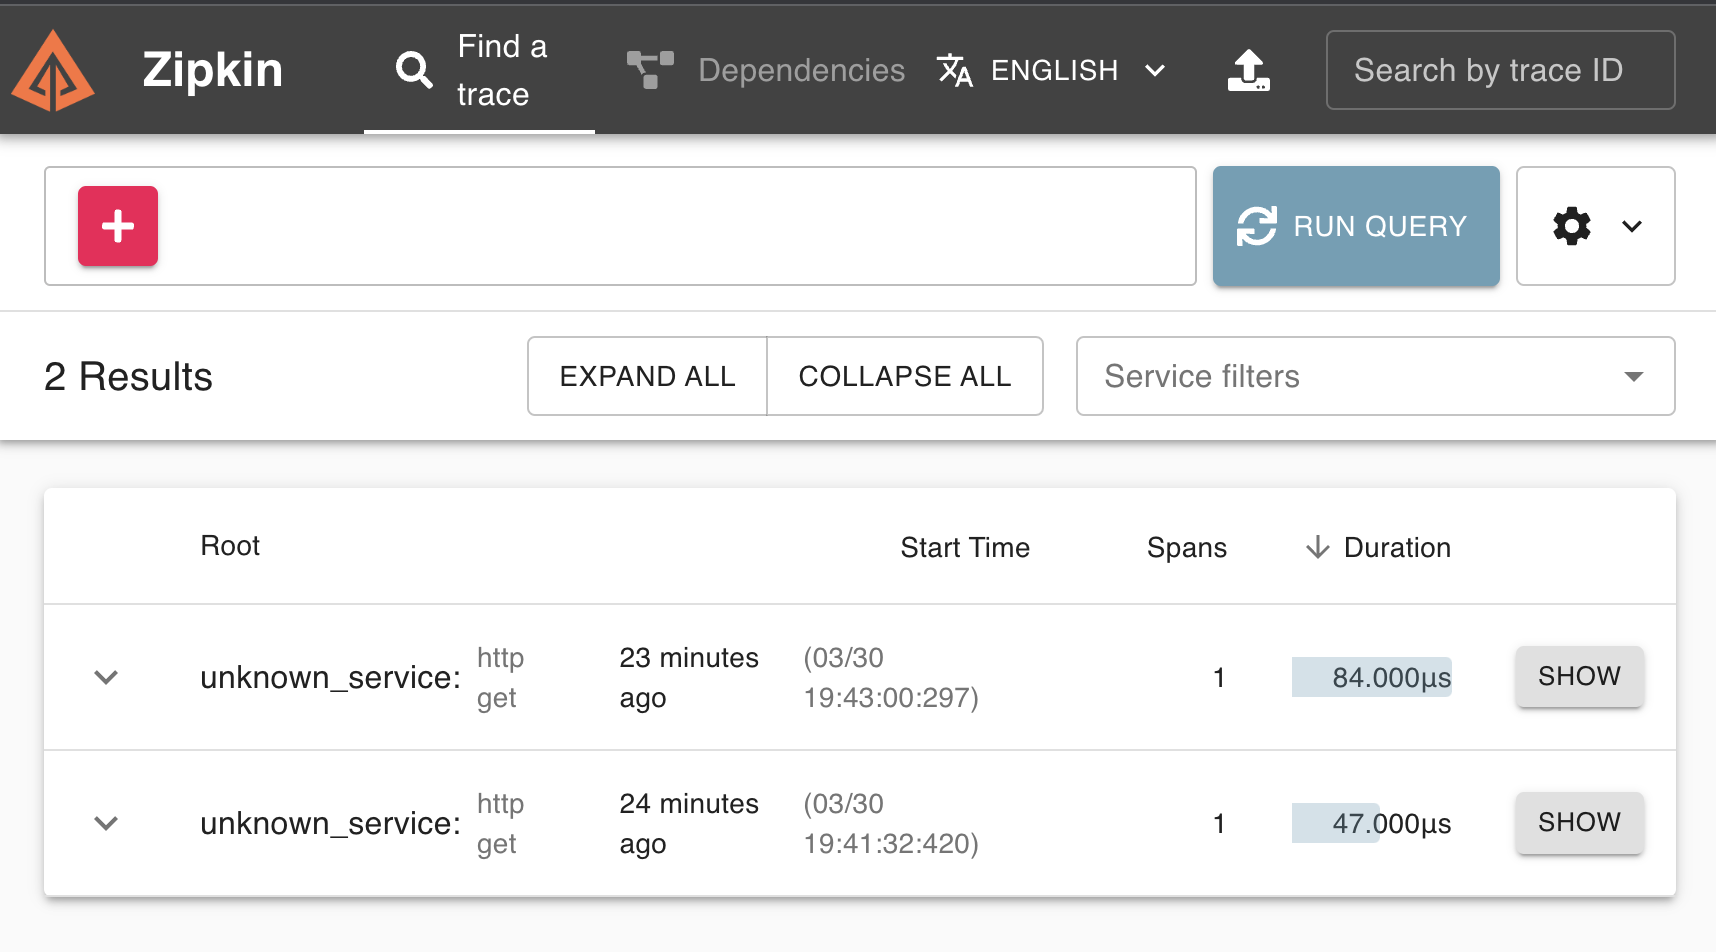
OPT1 - Build & Start a ‘Distributed Tracing backend Zipkin (but I would recommend to go with OPT2 - Jaeger)
docker run --rm -d -p 9411:9411 --name zipkin openzipkin/zipkin
this will spin up a zipkin with UI on http://localhost:9411/zipkin/
Update Gemfile/require and ENV accordingly
require 'opentelemetry-exporter-zipkin'
# ....
ENV['OTEL_TRACES_EXPORTER'] = 'zipkin'

# if you want a custom endpoint
# ENV['OTEL_EXPORTER_ZIPKIN_ENDPOINT'] = 'http://localhost:1234'
curl the app again
curl http://localhost:9292
and query your Zipkin UI, you should see the traces there

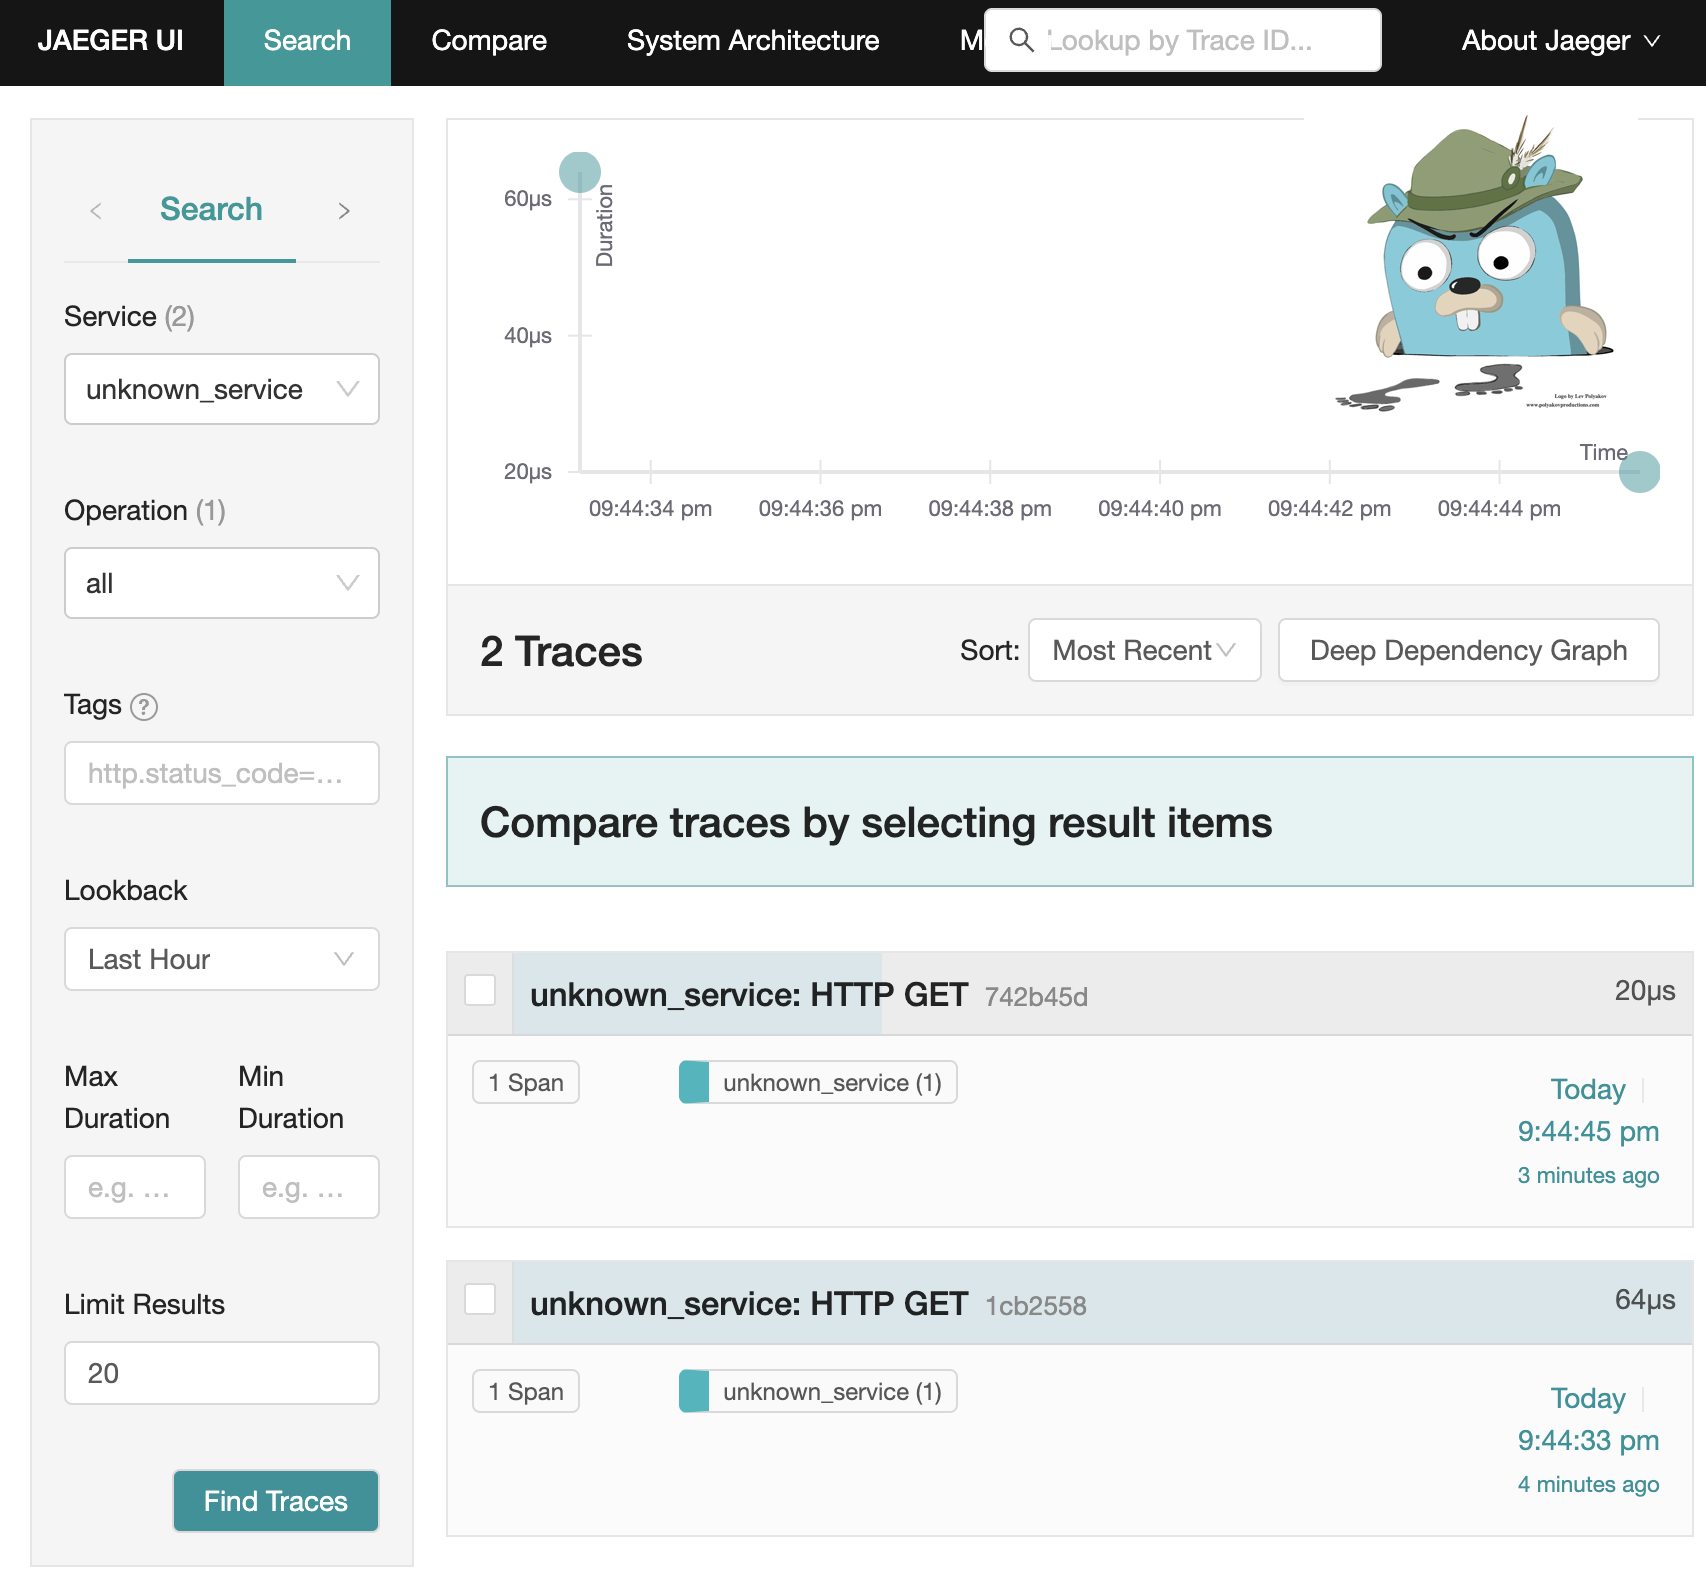
OPT2(preferred) Alternative to Zipkin- Jeeger (it is in GO, and fresher then Zipkin)
Pour some Jeeger(meister)
docker run -d --name jaeger \
  -e COLLECTOR_ZIPKIN_HTTP_PORT=9411 \
  -p 5775:5775/udp \
  -p 6831:6831/udp \
  -p 6832:6832/udp \
  -p 5778:5778 \
  -p 16686:16686 \
  -p 14268:14268 \
  -p 14250:14250 \
  -p 9411:9411 \
  jaegertracing/all-in-one
Update Gemfile/require and ENV accordingly
require 'opentelemetry/exporter/jaeger'

ENV['OTEL_TRACES_EXPORTER'] = 'jaeger'
curl the app again
curl http://localhost:9292
hunt it down via Jaeger UI like a boss (http://localhost:16686/)

Important concepts of Context and Propagation
There are 2 types of Context
- Span Context
- Trace ID
- Span ID
- Trace Flags
- Trace State
- Correlation Context
- user-defined key-value pairs
Propagation
Propagation is the mechanism that moves data between services and processes. Although not limited to tracing, it is what allows traces to build causal information about a system across services that are arbitrarily distributed across process and network boundaries.